Hyperspectral technology can be used for spectral measurement and simultaneous sampling analysis of water bodies, and the obtained data can be analyzed by spectral separation method to separate characteristic peaks of cyanobacteria and suspended matter, and establish peak height and chlorophyll-a concentration obtained by simultaneous water quality sampling Correspondence between the concentration of suspended matter and its quantitative inversion algorithm of remote sensing.
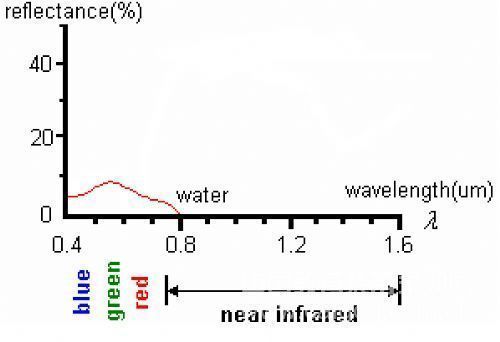
Figure 1: Characteristic curve of reflection spectrum of water body: blue and green bands are reflection bands; near and mid-infrared bands are full absorption bands
The eutrophication of inland water bodies has been serious in the past ten years, and algae have multiplied and even formed bloom disasters, which have caused serious damage to the main functions of drinking water, tourism, and breeding in the lake area. The main water quality parameters such as chlorophyll-a and suspended solids in typical lakes are tested, but the traditional methods of determining the concentration through manual sampling, filtration, extraction and spectrophotometer analysis are more time-consuming and laborious. The hyperspectral remote sensing monitoring method can reflect the distribution and changes of water quality in space and time, and find some pollution sources and migration characteristics of pollutants that are difficult to be revealed by conventional methods. It also has a wide monitoring range, fast speed, low cost, and is convenient for long-term dynamic monitoring. The advantages. The application of remote sensing in the study of inland water bodies has gradually evolved from the initial simple water identification to the remote sensing monitoring, mapping and prediction of water quality parameters. With the continuous development of remote sensing technology and the deepening of the research on the spectral characteristics and algorithms of water quality parameters, the water quality monitored by remote sensing has gradually developed from qualitative to quantitative, and the types of water quality parameters that can be monitored through remote sensing have gradually increased, including chlorophyll a concentration and suspended solids concentration. , Yellow substance concentration, etc., the inversion accuracy has also been continuously improved. In recent years, the development of hyperspectral remote sensing technology and its application to remote monitoring of water quality have greatly improved the accuracy of remote sensing estimation of water quality parameters.
1. Principles and methods of remote sensing water quality monitoring
The spectral characteristics of features reflect the properties and status of the features themselves. Different features have different spectral characteristics. The spectral characteristics of a water body are determined by the absorption and scattering properties of various optically active substances in it. The spectral characteristics of the water body obtained by measuring the radiation value of the water body in a certain wavelength range through the remote sensing system are the basis for remotely monitoring the water quality of the water body. The solar radiation transmitted through the earth's atmosphere reaches the air-water interface, part of which is reflected, and the other part is refracted into the water body. This part of the incident light is selectively absorbed and scattered by various molecules under the water surface. There are three main types of substances that affect spectral reflectance in inland water bodies: â‘ Phytoplankton, mainly various algae; â‘¡Organic debris resulting from the death of phytoplankton and resuspended by terrestrial or lake bottom mud Inorganic suspended particles, collectively referred to as non-pigment suspended matter (hereinafter referred to as suspended matter); â‘¢ Dissolved organic matter composed of fulvic acid, humic acid, etc., usually called yellow matter. Among these substances, except that the suspended matter does not obviously absorb light under its natural concentration, the other two substances respectively choose to absorb light in a certain wavelength range to form their own characteristic absorption spectrum. At the same time, the scattering of light by these substances changes the direction of the light. The backscattered light returns to the water surface together with the reflected light from the bottom of the water, and returns to the atmosphere through the water-air interface. It is a part that can be measured by hyperspectral technology. The water body's absorption and scattering changes due to the different components and their contents make the spectral reflectance of a certain wavelength range significantly different, which is the basis for quantitative estimation of water quality parameters of inland water bodies.
2. Remote sensing quantitative monitoring of chlorophyll a concentration in inland water bodies
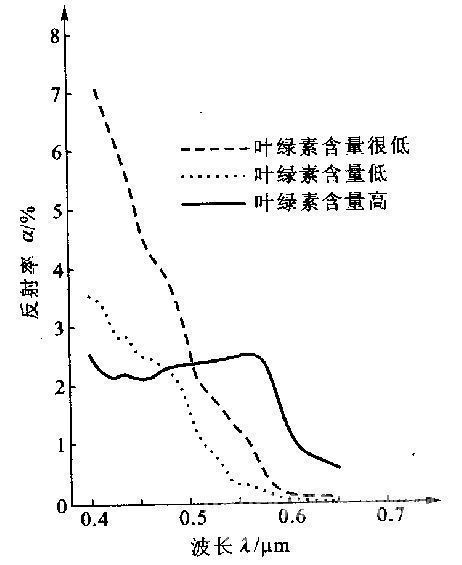
The selection of the optimal band for calculating the concentration of chlorophyll a depends on the concentration of chlorophyll a. Chlorophyll a has significant absorption around 440 nm in the blue band and 678 nm in the red band. When the algae density is high, the absorption peak of the water spectrum reflection curve appears near these two bands. The green reflection peak near 550 ~ 570 nm can be used as a quantitative indicator of chlorophyll a. Near 685 nm, chlorophyll a has a significant fluorescence peak. The most significant spectral characteristic of water bodies containing algae is the reflection peak at 685 ~ 715 nm. The peak is an indicator of chlorophyll a concentration. According to Gitelson's research, when the concentration of chlorophyll a increased from a very low value to 100 g / L, the diagnostic band of chlorophyll moved to the long-wave direction, and the reflection peak moved from around 685 nm to around 715 nm. The concentration of suspended matter and chlorophyll a have a great correlation. Pulliainen proposed to classify the monitored water according to the concentration of suspended matter, and then select an appropriate algorithm for different categories to calculate the concentration of chlorophyll a, which can improve the accuracy of the algorithm.
Hyperspectral technology can be used for spectral measurement and simultaneous sampling analysis of water bodies, and the obtained data can be analyzed by spectral separation method to separate characteristic peaks of cyanobacteria and suspended matter, and establish peak height and chlorophyll-a concentration obtained by simultaneous water quality sampling Correspondence between the concentration of suspended matter and its quantitative inversion algorithm of remote sensing.
Figure 1: Characteristic curve of reflection spectrum of water body: blue and green bands are reflection bands; near and mid-infrared bands are full absorption bands
The eutrophication of inland water bodies has been serious in the past ten years, and algae have multiplied and even formed bloom disasters, which have caused serious damage to the main functions of drinking water, tourism, and breeding in the lake area. The main water quality parameters such as chlorophyll-a and suspended solids in typical lakes are tested, but the traditional methods of determining the concentration through manual sampling, filtration, extraction and spectrophotometer analysis are more time-consuming and laborious. The hyperspectral remote sensing monitoring method can reflect the distribution and changes of water quality in space and time, and find some pollution sources and migration characteristics of pollutants that are difficult to be revealed by conventional methods. It also has a wide monitoring range, fast speed, low cost, and is convenient for long-term dynamic monitoring. The advantages. The application of remote sensing in the study of inland water bodies has gradually evolved from the initial simple water identification to the remote sensing monitoring, mapping and prediction of water quality parameters. With the continuous development of remote sensing technology and the deepening of the research on the spectral characteristics and algorithms of water quality parameters, the water quality monitored by remote sensing has gradually developed from qualitative to quantitative, and the types of water quality parameters that can be monitored through remote sensing have gradually increased, including chlorophyll a concentration and suspended solids concentration. , Yellow substance concentration, etc., the inversion accuracy has also been continuously improved. In recent years, the development of hyperspectral remote sensing technology and its application to remote monitoring of water quality have greatly improved the accuracy of remote sensing estimation of water quality parameters.
1. Principles and methods of remote sensing water quality monitoring
The spectral characteristics of features reflect the properties and status of the features themselves. Different features have different spectral characteristics. The spectral characteristics of a water body are determined by the absorption and scattering properties of various optically active substances in it. The spectral characteristics of the water body obtained by measuring the radiation value of the water body in a certain wavelength range through the remote sensing system are the basis for remotely monitoring the water quality of the water body. The solar radiation transmitted through the earth's atmosphere reaches the air-water interface, part of which is reflected, and the other part is refracted into the water body. This part of the incident light is selectively absorbed and scattered by various molecules under the water surface. There are three main types of substances that affect spectral reflectance in inland water bodies: â‘ Phytoplankton, mainly various algae; â‘¡Organic debris resulting from the death of phytoplankton and resuspended by terrestrial or lake bottom mud Inorganic suspended particles, collectively referred to as non-pigment suspended matter (hereinafter referred to as suspended matter); â‘¢ Dissolved organic matter composed of fulvic acid, humic acid, etc., usually called yellow matter. Among these substances, except that the suspended matter does not obviously absorb light under its natural concentration, the other two substances respectively choose to absorb light in a certain wavelength range to form their own characteristic absorption spectrum. At the same time, the scattering of light by these substances changes the direction of the light. The backscattered light returns to the water surface together with the reflected light from the bottom of the water, and returns to the atmosphere through the water-air interface. It is a part that can be measured by hyperspectral technology. The water body's absorption and scattering changes due to the different components and their contents make the spectral reflectance of a certain wavelength range significantly different, which is the basis for quantitative estimation of water quality parameters of inland water bodies.
2. Remote sensing quantitative monitoring of chlorophyll a concentration in inland water bodies
The selection of the optimal band for calculating the concentration of chlorophyll a depends on the concentration of chlorophyll a. Chlorophyll a has significant absorption around 440 nm in the blue band and 678 nm in the red band. When the algae density is high, the absorption peak of the water spectrum reflection curve appears near these two bands. The green reflection peak near 550 ~ 570 nm can be used as a quantitative indicator of chlorophyll a. Near 685 nm, chlorophyll a has a significant fluorescence peak. The most significant spectral characteristic of water bodies containing algae is the reflection peak at 685 ~ 715 nm. The peak is an indicator of chlorophyll a concentration. According to Gitelson's research, when the concentration of chlorophyll a increased from a very low value to 100 g / L, the diagnostic band of chlorophyll moved to the long-wave direction, and the reflection peak moved from around 685 nm to around 715 nm. The concentration of suspended matter and chlorophyll a have a great correlation. Pulliainen proposed to classify the monitored water according to the concentration of suspended matter, and then select an appropriate algorithm for different categories to calculate the concentration of chlorophyll a, which can improve the accuracy of the algorithm.
Figure 2: Reflectance spectra of water bodies with different chlorophyll content
When monitoring the water quality of different lakes, the commonly used method is to carry out various combinations of near infrared and red band reflectance ratio, red band and blue band reflectance ratio, 660 ~ 680 nm and 685 ~ 715 nm bands. Experiment to find the best band combination. The monitoring method can pre-classify lakes according to their nutritional status, and then select different algorithms for different lake types to improve the accuracy and universal applicability of the algorithms.
3. Remote sensing quantitative monitoring of suspended solids concentration in inland water bodies
The concentration of suspended matter in inland water is the first water quality parameter estimated by remote sensing. The concentration of suspended matter, particle size and its composition are the main factors affecting the spectral reflection of suspended matter. Carpenter's research proves the feasibility of using remote sensing to quantitatively monitor suspended solids. Kallio et al. Used AISA imaging spectroscopy data to study lakes in southern Finland. The results show that the best algorithm for estimating suspended solids can be obtained using the single-band reflectance R705-7l4 from 705 to 714 nm. The research by Gitelson et al. Shows that the 500-600 nm band is suitable for monitoring suspended solids, and the reflectivity in the 700-900 nm band is sensitive to changes in suspended solids concentration. In the visible and near-infrared bands, with the increase of suspended matter content, the reflectivity of the water body increases and with the increase of suspended matter concentration, the position of the reflection peak moves to the long wave direction.
When the concentration of suspended matter is in the range of 0.50 mg / L, the reflectance and suspended matter concentration in any wave band are significantly related, but as the concentration of suspended matter in the water increases, the reflected radiation caused by the suspended matter will reach saturation. The saturation concentration of suspended matter is different in different waveband ranges. In the short-wavelength region, the saturation concentration of suspended matter is low. Therefore, when the concentration of suspended matter in the water is very high, the long wave range should be selected when constructing the model. But the suspended matter algorithm has time and water specificity. Although acceptable accuracy results have been achieved in specific lakes or lake groups, it is difficult to extrapolate to other lakes.
4. Remote sensing quantitative monitoring of the concentration of yellow matter in inland water bodies
The research on yellow matter at home and abroad starts with the ocean. Since Kalle (1949) first used ultraviolet rays to irradiate seawater to discover the presence of yellow substances in water, many scholars have conducted a lot of research on the optical properties of yellow substances, especially their absorption characteristics, and proposed suitable for ultraviolet and visible light bands. The absorption curve describes the equation.
Since the 1990s, foreign scholars have begun to study the light absorption characteristics of yellow matter in inland water bodies, and carry out quantitative remote sensing monitoring of yellow matter. Pegau measured the s-value of 26 yellow water samples from Pond Lake in Idaho, USA. Gitelson proposed a regression algorithm for calculating yellow matter by analyzing the spectral characteristics of inland water quality parameters and regression experiments: CDOM = a × Zb; where a and b are the coefficients that can be obtained by regression calculation; z is a pair of yellow The reflectance function of the band that is most sensitive to the substance and least sensitive to other interference factors. The yellow matter concentration inversion is obtained by using the band reflectance ratio or the band reflectance addition and subtraction ratio at 700, 675, 620, 560, 480, and 430 nm wavelengths, and a high accuracy is obtained. The error of CDOM is less than 0.65 mg / cm3 . There is little research on yellow matter in inland water bodies in China.
5. Acquisition of hyperspectral data commonly used in water quality remote sensing monitoring
5.1 Non-imaging spectrometer data. Non-imaging spectrometer mainly refers to various ground spectrometers used in field work. The spectral reflectance of ground features is not recorded in the form of images, but recorded in non-image forms such as graphics. Common ASD field spectrometers, portable hyperspectrometers, etc.
5.2 Imaging spectrometer data. Imaging spectrometer, also known as hyperspectral imager, is essentially a remote sensing technology that combines two-dimensional images and spectrum measurement of ground features into one, and its spectral resolution is up to nanometers. The data of hyperspectral imaging is the image of a sample obtained from a stack of continuous multiple band imaging, which is commonly known as the image cube (Image cube), see Figure 1. There are three main ways to obtain this image cube:
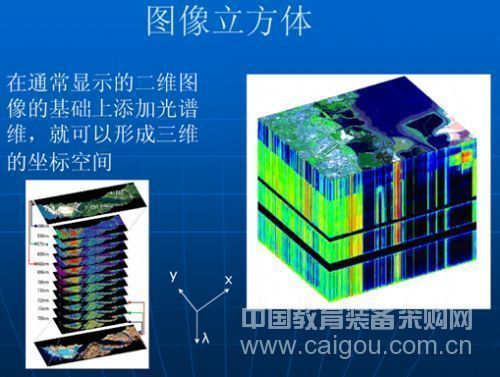
Figure 3: A typical hyperspectral image cube
The first type is of aerospace level. For example, the Shenzhou VII spacecraft in China is equipped with a similar imaging spectrometer. The imaging spectrometer used is very large, and the cost of each experiment is very large;
The second type is the aviation level. The use of small aircraft or drones as a platform for the spectrometer is currently the main method of remote sensing imaging. However, it is not easy to obtain better experimental results, requiring precise GPS and inertial navigation positioning, high-performance computers and high-frequency shooting speed.
The third type is the ground level. The push-broom imaging spectrometer is placed on the ground and equipped with a rotary or linear stage for spectral scanning. There are now new types of ground imaging spectrometers, such as the US SOC710 / SOC730, which use the internal scanning device to achieve push-broom imaging, that is, the spectrometer and the measured object can complete hyperspectral imaging without movement, without the need to be equipped with a translation stage. This greatly reduces the weight of the instrument and makes it easier to use.
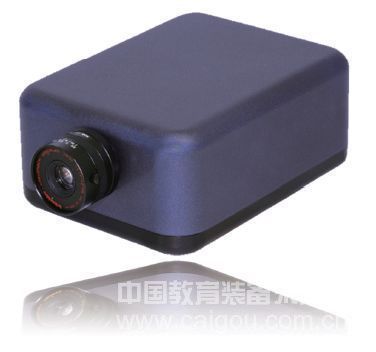
Figure 4: Imaging spectrometer SOC710 Hyperspectral imager, built-in scanning device, no need to shift the gimbal
The above three methods can be used to conduct hyperspectral imaging and remote sensing research on water quality, and estimate some water quality parameters, such as chlorophyll concentration, suspended matter concentration, and dissolved organic matter.
The application of hyperspectral remote sensing in the monitoring of inland water quality demonstrates the huge application potential of water quality remote sensing monitoring methods and the unmatched advantages of conventional monitoring methods. With the rapid development of sensor technology, high resolution, hyperspectral and multipolarization Remote sensing data will become the mainstream remote sensing information source, providing data guarantee for the micro-quantitative water quality monitoring of remote sensing.
Figure 2: Reflectance spectra of water bodies with different chlorophyll content
When monitoring the water quality of different lakes, the commonly used method is to carry out various combinations of near infrared and red band reflectance ratio, red band and blue band reflectance ratio, 660 ~ 680 nm and 685 ~ 715 nm bands. Experiment to find the best band combination. The monitoring method can pre-classify lakes according to their nutritional status, and then select different algorithms for different lake types to improve the accuracy and universal applicability of the algorithms.
3. Remote sensing quantitative monitoring of suspended solids concentration in inland water bodies
The concentration of suspended matter in inland water is the first water quality parameter estimated by remote sensing. The concentration of suspended matter, particle size and its composition are the main factors affecting the spectral reflection of suspended matter. Carpenter's research proves the feasibility of using remote sensing to quantitatively monitor suspended solids. Kallio et al. Used AISA imaging spectroscopy data to study lakes in southern Finland. The results show that the best algorithm for estimating suspended solids can be obtained using the single-band reflectance R705-7l4 from 705 to 714 nm. The research by Gitelson et al. Shows that the 500-600 nm band is suitable for monitoring suspended solids. The reflectivity in the 700-900 nm band is sensitive to changes in suspended solids concentration, and is the best band for estimating suspended solids concentration by remote sensing. In the visible and near-infrared bands, with the increase of suspended matter content, the reflectivity of the water body increases and with the increase of suspended matter concentration, the position of the reflection peak moves to the long wave direction.
When the concentration of suspended matter is in the range of 0.50 mg / L, the reflectance and suspended matter concentration in any wave band are significantly related, but as the concentration of suspended matter in the water increases, the reflected radiation caused by the suspended matter will reach saturation. The saturation concentration of suspended matter is different in different waveband ranges. In the short-wavelength region, the saturation concentration of suspended matter is low. Therefore, when the concentration of suspended matter in the water is very high, the long wave range should be selected when constructing the model. But the suspended matter algorithm has time and water specificity. Although acceptable accuracy results have been achieved in specific lakes or lake groups, it is difficult to extrapolate to other lakes.
4. Remote sensing quantitative monitoring of the concentration of yellow matter in inland water bodies
The research on yellow matter at home and abroad starts with the ocean. Since Kalle (1949) first used ultraviolet rays to irradiate seawater to discover the presence of yellow substances in water, many scholars have conducted a lot of research on the optical properties of yellow substances, especially their absorption characteristics, and proposed suitable for ultraviolet and visible light bands. The absorption curve describes the equation.
Since the 1990s, foreign scholars have begun to study the light absorption characteristics of yellow matter in inland water bodies, and carry out quantitative remote sensing monitoring of yellow matter. Pegau measured the s-value of 26 yellow water samples from Pond Lake in Idaho, USA. Gitelson proposed a regression algorithm for calculating yellow matter by analyzing the spectral characteristics of inland water quality parameters and regression experiments: CDOM = a × Zb; where a and b are the coefficients that can be obtained by regression calculation; z is a pair of yellow The reflectance function of the band that is most sensitive to the substance and least sensitive to other interference factors. The yellow matter concentration inversion is obtained by using the band reflectance ratio or the band reflectance addition and subtraction ratio at 700, 675, 620, 560, 480, and 430 nm wavelengths, and a high accuracy is obtained. The error of CDOM is less than 0.65 mg / cm3 . There is little research on yellow matter in inland water bodies in China.
5. Acquisition of hyperspectral data commonly used in water quality remote sensing monitoring
5.1 Non-imaging spectrometer data. Non-imaging spectrometer mainly refers to various ground spectrometers used in field work. The spectral reflectance of ground features is not recorded in the form of images, but recorded in non-image forms such as graphics. Common ASD field spectrometers, portable hyperspectrometers, etc.
5.2 Imaging spectrometer data. Imaging spectrometer, also known as hyperspectral imager, is essentially a remote sensing technology that combines two-dimensional images and spectrum measurement of ground features into one, and its spectral resolution is up to nanometers. The data of hyperspectral imaging is the image of a sample obtained from a stack of continuous multiple band imaging, which is commonly known as the image cube (Image cube), see Figure 1. There are three main ways to obtain this image cube:
Figure 3: A typical hyperspectral image cube
The first type is of aerospace level. For example, the Shenzhou VII spacecraft in China is equipped with a similar imaging spectrometer. The imaging spectrometer used is very large, and the cost of each experiment is very large;
The second type is the aviation level. The use of small aircraft or drones as a platform for the spectrometer is currently the main method of remote sensing imaging. However, it is not easy to obtain better experimental results, requiring precise GPS and inertial navigation positioning, high-performance computers and high-frequency shooting speed.
The third type is the ground level. The push-broom imaging spectrometer is placed on the ground and equipped with a rotary or linear stage for spectral scanning. There are now new types of ground imaging spectrometers, such as the US SOC710 / SOC730, which use the internal scanning device to achieve push-broom imaging, that is, the spectrometer and the measured object can complete hyperspectral imaging without movement, without the need for a translation stage This greatly reduces the weight of the instrument and makes it easier to use.
Figure 4: Imaging spectrometer SOC710 Hyperspectral imager, built-in scanning device, no need to shift the gimbal
The above three methods can be used to conduct hyperspectral imaging and remote sensing research on water quality, and estimate some water quality parameters, such as chlorophyll concentration, suspended matter concentration, and dissolved organic matter.
The application of hyperspectral remote sensing in the monitoring of inland water quality demonstrates the huge application potential of water quality remote sensing monitoring methods and the unmatched advantages of conventional monitoring methods. With the rapid development of sensor technology, high resolution, hyperspectral and multipolarization Remote sensing data will become the mainstream remote sensing information source, providing data guarantee for the micro-quantitative water quality monitoring of remote sensing.
The Vibration Platform Machine is a new kind of Fitness Equipment is the world markets . It is a slim Full Body Vibration Machine . It is also called LCD MP3 Music Function Vibration Machine or Fitness Vibration Platform Exercise Machine . It is hot sell and popular in many countries .
The machine main function is body sculpting , lose weight , body building prevents disease. The product applies to all people, but children and the elderly need to be used by their family.Heart disease, high blood pressure people with other diseases use the machine need to carefully.
Vibration Platform Machine
Vibration Platform Machine,Voltage Vibration Machine,Vibration Platform Exercise Machine,220V Voltage Vibration Machine
ZHEJIANG MEIER FITNESS EQUIPMENT CO., LTD , http://www.chinameier.com